
As per the NSSO sample surveys, manufacturing employment has declined from 12.6% in 2011-12 to 11.4% in 2022-23.
| Photo Credit: Udit Kulshrestha
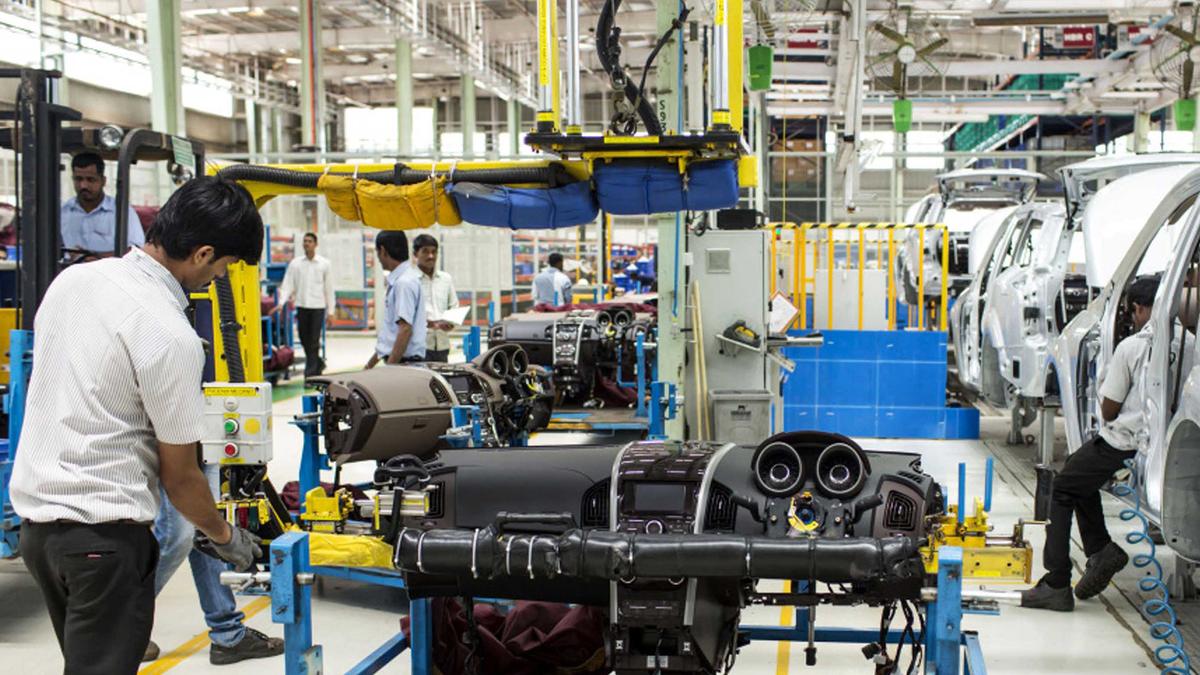
On September 25, 2014, the newly elected Union government initiated the Make in India (MI) policy with two objectives: (i) to raise the manufacturing sector’s share in GDP to 25% (from 14%-15%), and (ii) to create 100 million additional industrial jobs (from about 60 million) by 2025. The policy was similar to the New Manufacturing Policy 2012, formulated but not implemented. The policy context: though India’s annual real (net of inflation) GDP growth rate had accelerated to 7%-8% during the previous decade with rising export share, especially during 2003-08, manufacturing sector performance was modest, with increasing net imports and modest employment expansion.
Ten years on, what are the policy outcomes? According to the National Accounts Statistics (NAS), the manufacturing real gross value added (GVA) growth rate has slowed down from 8.1 during 2001-12 to 5.5% during 2012-23 (Chart 1).
Chart 1 | Manufacturing sector GVA growth rate at constant prices
Chart appears incomplete? Click to remove AMP mode
The sector’s GDP share has stagnated at 15%-17% over the last three decades, though it is slightly higher in the latest GDP series due to methodological changes (Chart 2).
Chart 2 | The chart shows the manufacturing (MFG) sector’s share in GDP at constant prices (1991-2023)
As per the NSSO sample surveys, manufacturing employment has declined from 12.6% in 2011-12 to 11.4% in 2022-23. Unorganised or informal sector manufacturing accounts for most employment, declining by 8.2 million, from 38.8 million in 2015-16 to 30.6 million by 2022-23, as per surveys of unincorporated sector enterprises. Agriculture’s share in the workforce increased from 42.5% in 2018-19 to 45.8% in 2022-23 (Chart 3).
Chart 3 | The chart shows the shares of agriculture and manufacturing in total employment (1994-2023)
The preceding reversal of structural transformation from a higher to a lower productivity sector is unprecedented in post-independent India. It is the clearest sign yet of premature de-industrialisation, that is, before attaining industrial maturity as in the advanced countries.
Why is India deindustrialising? Why did industrial production growth plummet despite the official real GDP growth rate of 6%-7% annually? Fixed investment growth practically collapsed. Chart 4 shows the annual growth rate in GVA and gross fixed capital formation (GFCF) from 2012-13 to 2019-20 as per National Accounts Statistics (NAS) and Annual Survey of Industries (ASI).
Chart 4 | The chart shows average growth rates of GVA and GFCF (2012-13 to 2019-20)
We focus on time-tested ASI figures as the NAS figures are overestimated due to methodological problems. The industrial output growth rate is much lower than the official NAS-based estimates. The GFCF growth rate during the period is practically zero. Unsurprisingly, booming imports, mainly from China, have met the demand (Chart 5).
Chart 5 | The chart shows India’s trade imbalance with China
Why did not domestic investments grow under MI, despite India’s rank in the World Bank’s Ease of Doing Business (EDB) index, improving from 142 in 2014-15 to 63 in 2019-20? Because EDB is a bogus, politically motivated index with little analytical or empirical foundations. With hindsight, the government squandered away six precious years chasing a dubious index.
Click to subscribe to our Data newsletter
The key to reversing de-industrialisation is re-imagining industrial policy to align trade and industrial policies to promote domestic value addition and learning. Protection policies must promote securing a dynamic comparative advantage, not offer cash subsidies to gain a static comparative advantage. India must aim at investment-led growth and technological catching up. They must be supported by domestic R&D to promote adaptive research and the indigenisation of imported technology. Publicly funded development finance institutions or “policy banks” are needed to provide affordable long-term credit for socialising the risks of learning and catching up with the technological frontier.
Source: National Accounts Statistics, National Sample Survey Organisation, Ministry of Commerce and Industry, Annual Survey of Industries, and Periodic Labour Force Surveys
R Nagaraj is with the Centre for Liberal Education, IIT Bombay.
Also read: Tamil Nadu tops in electronics exports, by sending smartphones made in Kancheepuram to the U.S.: Data

Published – October 02, 2024 07:00 am IST